


Latest News


"Flowers" by the late artist and writer Joelle Sander.
Cornwall Library
Sander’s first book, “The Family: The Evolution of Our Oldest Human Institution,” was published in 1978 while she worked as an instructor with the Institute of Children’s Literature. She described the history book, which took young readers on a journey of the evolving family unit from the Ice Age to the 1970s, as a kind of anthropological tour. “Kids are exposed to so many families in this culture,” she told The Lakeville Journal at the time. “I felt the book would give them a perspective on families in other cultures, both historical and contemporary. In 1992, The Lakeville Journal reviewed another of her published works, “Before Their Time: Four Generations of Teenage Mothers,” which Sander wrote as a faculty member at Sarah Lawrence in Westchester County, N.Y., where she served as the associate director of The Center for Continuing Education and taught modern American poetry. She was also a volunteer at a New York YMCA. At this YMCA, she met a young single mother named Leticia, whose trauma, struggles and hopes for the future inspired Sander to share Leticia’s story as told through the personal histories of the women who had come before her. Lakeville Journal writer Richard O’Connor called the book’s psychological exploration of cyclical poverty both “wonderful and disturbing.”
Her first slim volume of poetry, “Margins of Light” was available for attendees of the show to read while they examined Sanders’ paintings, a dual experience to take in the twin passions of her lengthy artistic career.
“Live It Up!” will be on view at The Cornwall Library through Saturday, May 18.
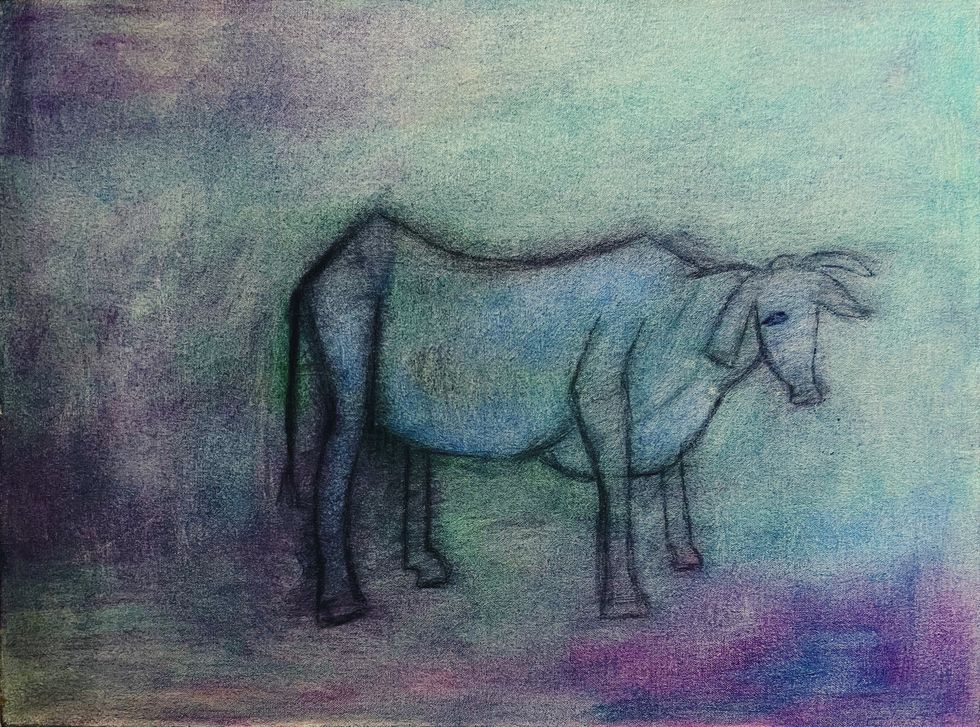 "Cow," by Joelle Sander.Cornwall Library

Rabbi Zach Fredman
Zivar Amrami
He has since relocated with his family to Germantown and founded Temenos, “a home for ritual and creativity that honors the wild humanity of all people,” as the website explains (temenosnyc.com). At these feasts, Fredman and his brother, a chef, would create a menu to highlight the symbolism and mythology of certain Jewish holidays.
“People loved it,” explained Fredman. “It’s kind of a two-pronged approach, a way to engage and digest symbolism through the belly.” The Seder (which means “order” in Hebrew) at Race Brook will be such an immersive experience: a four-course meal conducted in four parts, echoing the four cups of wine consumed during the ceremony.
Alex Harvey, arts programmer at Race Brook, and his wife, Sophia Akilova, have known Rabbi Fredman through various communities and music circles for many years. After moving to the Hudson Valley from Brooklyn, Akilova was “looking everywhere for some kind of Jewish community that was dynamic. There’s plenty of progressive Jewish communities,” Harvey continued, “but she was looking for something way more particular, a community that is rediscovering active prayer, actually somatic spirituality.”
Fredman spoke of Passover as an opportunity to reconnect with tradition while investigating present day reality through the core liberatory framework of the holiday. He said, “One of the major successes in Judaism is that the tradition was conceived as living. There’s the written material that’s passed on, that’s unchanging, but it’s always accompanied by oral teachings, teacher to student, teacher to student. And so there is a sense that tradition is alive and dependent on people making it fresh, making it new.”
The tradition will be made new once again with the addition of music at Race Brook by the powerful and virtuosic Duo Andalus with vocalist Lala Tamar. Tamar and Fredman, who is an incredibly accomplished musician as well, have been collaborating through Fredman’s group Epichorus for many years. Fredman will join Duo Andalus throughout the evening and the following evening (April 24), Epichorus featuring Tamar and Yacouba Sissoko, who plays the African Kora, will perform.
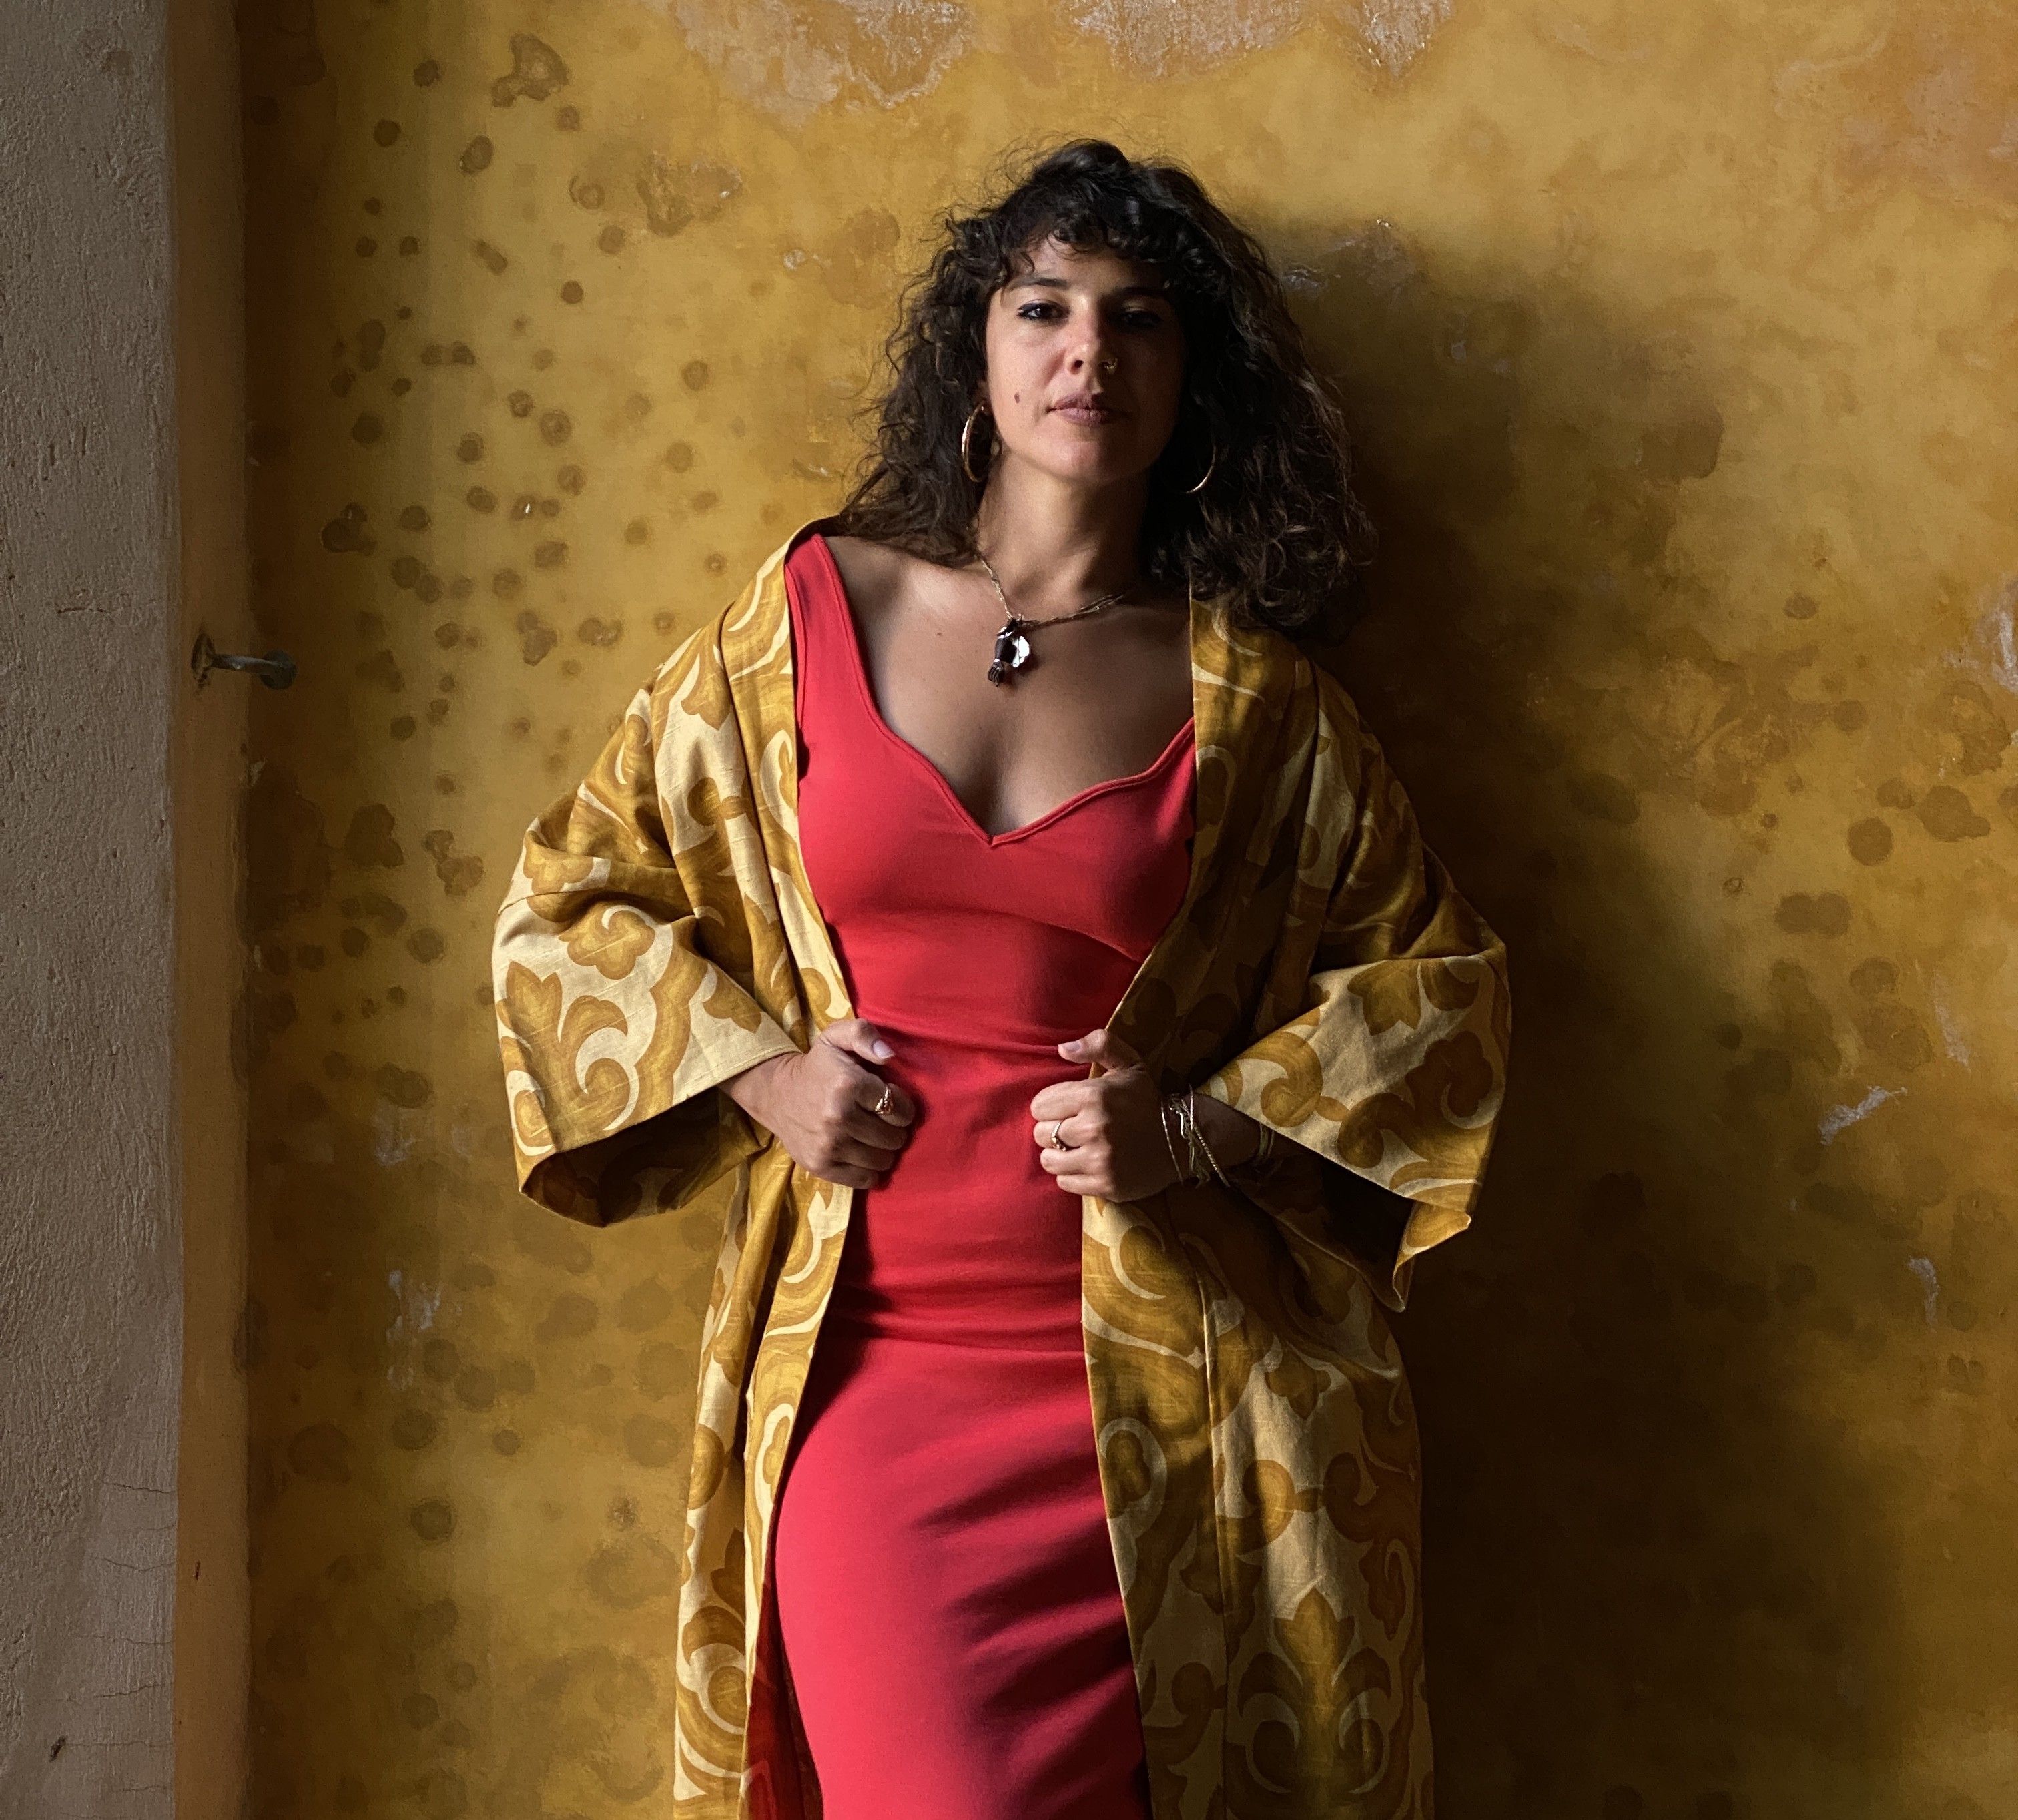 Lala TamarProvided
There are four questions that are asked during a Passover Seder, traditionally by the youngest person at the table. One of those questions is: “Why is this night different from all other nights?” Much of the rest of the Seder is in response to this question. When asked this particular question, Rabbi Fredman offered, “It’s been so overwhelming to watch the news cycle. It’s been a year where Judaism, Jewish identity, Jewish ethics, all of these things are completely different from what we thought they were even a year ago.” Fredman went on to speak about the fracturing that is occurring within the Jewish community and offered, “One of the functions of ritual, especially a ritual like this one, is to create space for people to have the conversations that we need to have.”
Creating a safe container for difference and for questioning is a tall order and one that Fredman meets with humility and curiosity. Of the Passover Seder he shared, “I’m hoping that in addition to the elements of food, and music, and teachings that there’s also space for people to be vulnerable and sift through some other profound experiences, painful experiences of the last six months and then, you know, investigate, turn things over and find something about themselves that helps us make sense of a disorienting moment.”
Reservations for Feast of Mystics, and The Epichorus featuring Yacouba Sissoko and Lala Tamar can be made at rblodge.com.